
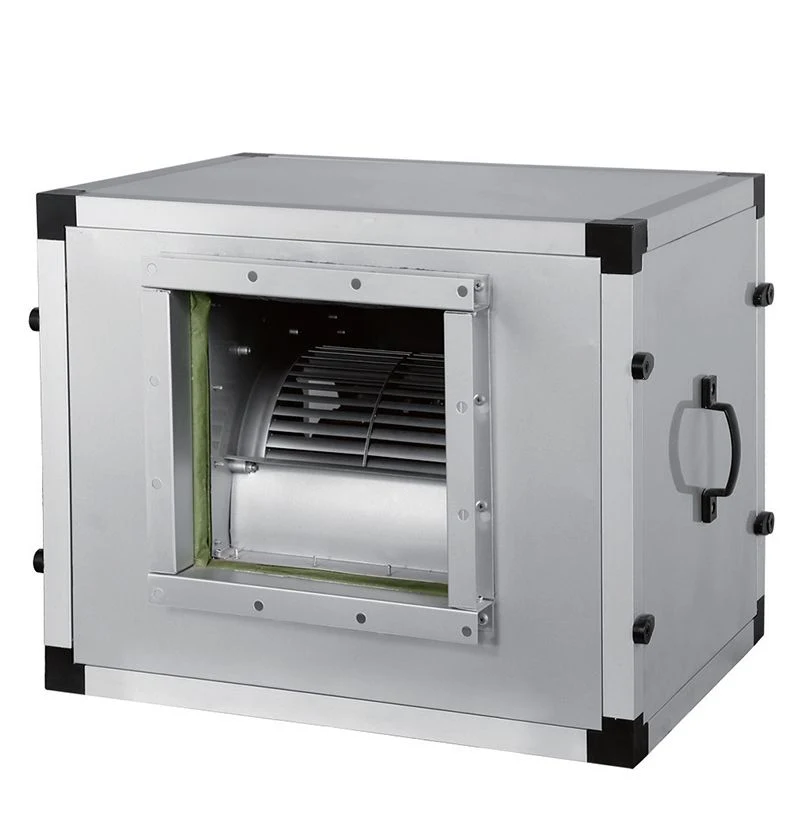
A fan curve describes performance under stated conditions; it is not a measurement of an installed system. Commissioning should verify the required airflow, pressure, speed and electrical duty using an agreed method and uncertainty. There is no universal 10–30% installation shortfall to assume before taking measurements.
Define what the measurement must establish
Confirm the required operating cases, fan configuration, installation category, gas conditions and pressure definition before testing. Inlet or outlet disturbances, accessory losses, leaks and control positions can change delivered performance. Some may be included in the design or quoted data; record the actual boundary rather than assuming none were considered.
An airflow traverse measures flow at a specified plane. By itself, it does not identify the cause of a shortfall or prove fan compliance. Combine it with suitable pressure, speed, power and configuration records. Agree the applicable field-test method, acceptance tolerance and measurement uncertainty before a contractual comparison.
Plan an appropriate velocity traverse
Duct velocity profiles can be asymmetric, swirling or locally reversed, especially near fittings. A centre reading is not a substitute for an area-based flow measurement and is not guaranteed to overstate the average in every disturbed duct. Choose a method appropriate to the flow and instrument range.
- Select and document the plane. Apply the chosen method's upstream and downstream requirements, access and traverse provisions. Record duct dimensions, straight lengths, disturbances and any departures. A vague allowance of several diameters is not an acceptance rule.
- Use the prescribed points and weights. An equal-area grid is one possible rectangular-duct approach; circular and other methods use their own locations and averaging rules. Follow the selected method rather than substituting convenient probe positions.
- Check instruments and conditions. Record calibration, zero, range, resolution, probe coefficient and orientation. Measure the temperature, pressure and other gas properties needed to establish density. Low differential pressures, swirl or reverse flow can invalidate a simple pitot interpretation.
- Convert the individual readings correctly. For suitable low-speed, one-direction flow, vᵢ = Cᵢ × √(2 Δpᵥ,ᵢ / ρ), with pressure in Pa and density in kg/m³. Apply the instrument and method corrections, then calculate the specified area-weighted mean velocity.
- Calculate flow and its basis. Q = Σ(Aᵢ × vᵢ). For equal-area cells this becomes total area × the arithmetic mean of their velocities. Record actual volume conditions and any conversion to standard volume or mass flow.
For a hypothetical equal-area, two-cell example with C = 1 and density 1.2 kg/m³, velocity pressures of 24 Pa and 96 Pa give velocities of approximately 6.325 m/s and 12.649 m/s. Their mean is approximately 9.487 m/s. Averaging the pressures first gives 60 Pa and then 10.000 m/s, approximately 5.41% higher. The example demonstrates the nonlinear conversion; two readings are not a valid general-purpose traverse plan.
If a plane fails the selected method's requirements, assess an approved alternative or the additional uncertainty. Label limitations explicitly. An unsuitable location cannot be made compliant merely by taking more readings or reporting more decimal places.
Static pressure difference is not fan total pressure
For low-speed flow using consistent station definitions, total pressure at a station is static pressure plus velocity pressure. Fan total pressure is outlet total pressure minus inlet total pressure: Δpt = (ps₂ + pv₂) - (ps₁ + pv₁). Apply the selected method's station, averaging and connection corrections to compare with the fan rating.
The difference ps₂ - ps₁ alone omits any difference in velocity pressure. It only equals that total-pressure difference where those velocity pressures cancel under the stated assumptions. Fan static pressure is also a defined fan-rating quantity: in the usual low-speed convention it is fan total pressure minus fan outlet velocity pressure. It is not generally the same as the difference between two static taps.
For a hypothetical low-speed example, ps₁ = -200 Pa, pv₁ = 50 Pa, ps₂ = 300 Pa and pv₂ = 100 Pa. Inlet total pressure is -150 Pa, outlet total pressure 400 Pa, and fan total pressure 550 Pa. The static-tap difference is 500 Pa; the corresponding fan static pressure is 450 Pa. These three figures must not be interchanged. AMCA's fan-curve explanation discusses the distinction between static and total ratings.
Other readings and their limits
Electrical input and motor current. Record suitable true-power measurements, supply conditions and the measurement boundary where power is part of acceptance. Current is useful for loading and imbalance checks, but current alone does not prove airflow or shaft power. Low current can have several causes, and excess current does not necessarily indicate excess airflow. For converter-fed motors, use suitable instruments and procedures. The DOE motor-load guide describes current, power-factor and load-estimation limitations.
Fan speed and direction. Measure actual fan rpm, not just supply frequency, controller display or nominal pulley ratio. Verify rotation against the assembly marking using an approved procedure. A centrifugal fan rotating backwards may still produce flow, but no universal half-flow factor applies. Check the actual design and measured performance.
Use the results as evidence for diagnosis
- Low flow with higher than expected pressure: inspect system resistance, dampers, filters and duty assumptions after confirming pressure definition, speed and measurement quality.
- A point below the applicable fan curve: investigate speed, rotation, inlet conditions, installation effects, mechanical condition and test corrections. Do not assign fault from an uncorrected pressure reading.
- Different flow totals at the fan and terminals: examine leakage, unmeasured branches, operating changes, density basis and instrument uncertainty. The difference is not automatically all duct leakage.
- Unexpected current or power: compare with the actual motor and fan data at the measured duty and check supply, drive and mechanical conditions.
Keep a repeatable commissioning record
Record equipment identifiers, fan arrangement, gas conditions, measurement plane and dimensions, point locations, raw readings, averaging and density calculations, pressure stations, instruments and calibration, uncertainty, speed and direction, electrical readings, control positions, filter condition and acceptance criteria. Include drawings and stated departures from the method so a later test can make a valid comparison.
Request a commissioning measurement scope. Send the fan selection and curves, installation drawings, required operating cases, available measurement access and contractual acceptance basis. Include existing readings and instrument details so the missing evidence can be identified before proposing a replacement or control change. See airflow-control options for planning the operating cases.